I've Got 99 Problems and Folder Redirection is Every One of Them. 2015 Testing Results. Part 2.

This is a multi-part article detailing our testing results and presentations for the 2015 series on Folder Redirection:
- I’ve Got 99 Problems and Folder Redirection is Every One of Them. 2015 Testing Results. Part 1.
- I’ve Got 99 Problems and Folder Redirection is Every One of Them. 2015 Testing Results. Part 2. (this article)
- I’ve Got 99 Problems and Folder Redirection is Every One of Them. 2015 Testing Results. Part 3.
File Server Capacity Tool
The File Server Capacity Tool (FSCT) is great for modelling a user home drive hosted on Windows file servers. I’ve covered how to use the FSCT previously, and the results of our tests have included various scenarios looking at CPU and disk performance.
File Server Capacity Tool CPU Performance
In this test with Windows Server 2008 R2 running on the file server, SMB 2.1 shows quite a large difference between the average and maximum CPU seen across each test, especially from 400 users and beyond.
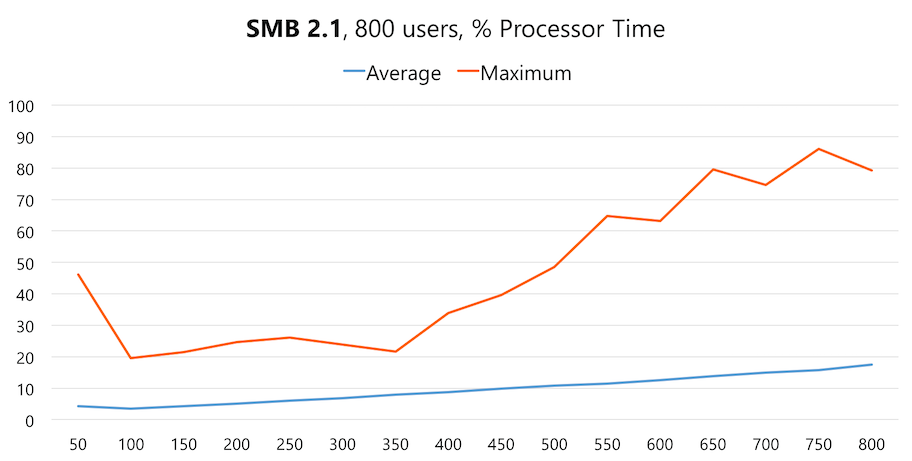
SMB 2.1 showed a big difference between the average and maximum CPU seen across each test.
The results from the tests with Windows Server 2012 R2 on the file server shows very similar average CPU, but a greatly reduced maximum CPU, which is great for overall file server resource consumption.
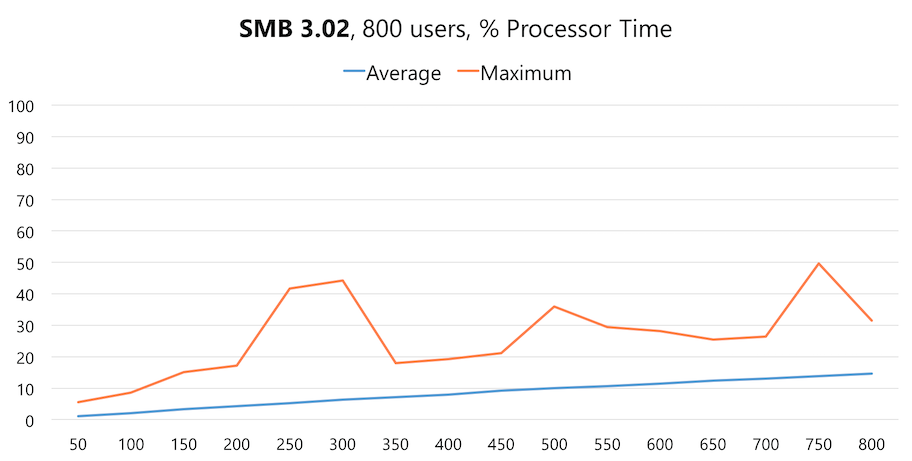
Lower CPU Utilization with SMB 3.02
Looking at the Impact of Anti-Virus
Running the same test with Windows Server 2012 R2, but this time with one of the major anti-virus products installed on the file server. This was installed with all of the default settings. This test shows a very interesting result when compared against the previous test - the chart below displays the same results as the previous test with the results from a testing run with AV:
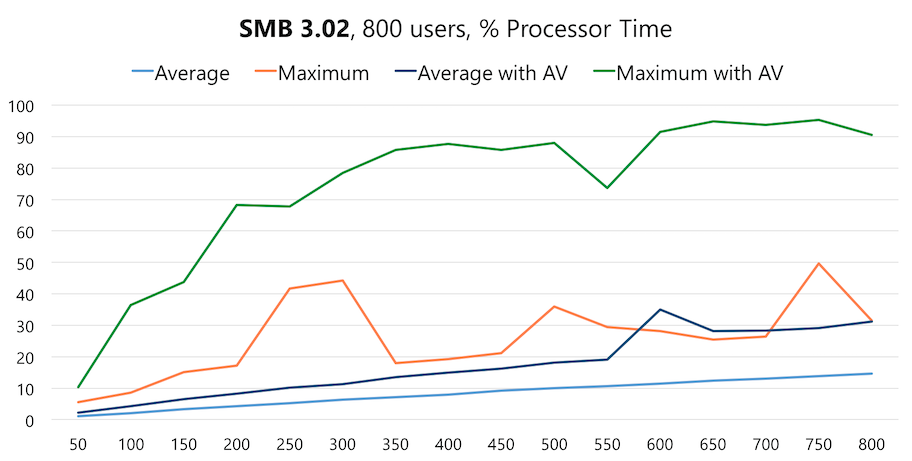
Anti-Virus Has a Large Impact on CPU
With anti-virus installed, the average CPU is now getting up around the maximum CPU seen without AV, especially from 600 users and beyond. Look at that maximum CPU recorded with anti-virus, that’s a massive difference from the previous test and will have a large impact on the file server!
To see if we could improve on this result, we re-ran the test with on-access scans disabled in the anti-virus configuration. This had little impact on the result, which could be explained by the FSCT workload being very write heavy.
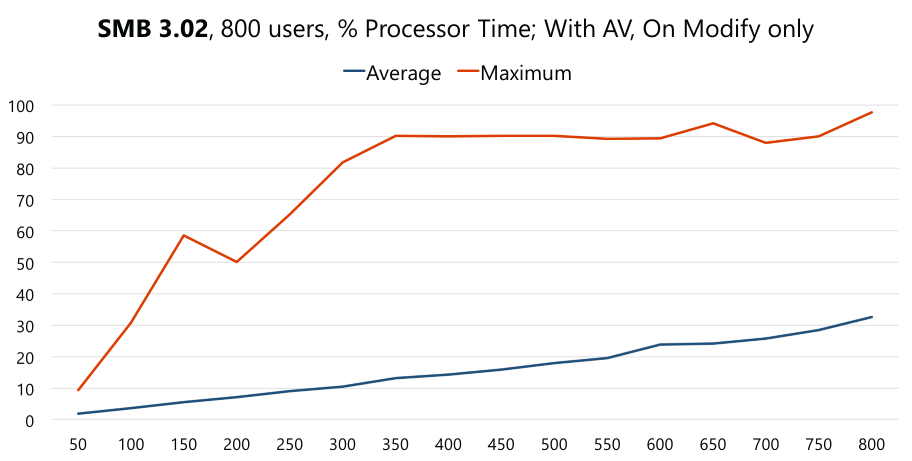
Disabling On Access Scans for AV Had Little Impact
There might be additional tweaking that may improve performance; however given the massive difference between with and without AV, I’m not confident that any considerable gains could be made. We haven’t yet had a chance to test with multiple anti-virus products.
File Server Capacity Tool Disk Performance
The FSCT workloads show some interesting results in regards to disk performance. First up is a correlation between high IO and high CPU - the more blocks generated on the storage (i.e. more blocks that are read or written from and to the file server, requires the file server to process it).
In the result below, we can see that when the IO peaks at near 2500 IOPS, the CPU makes a big jump as well:
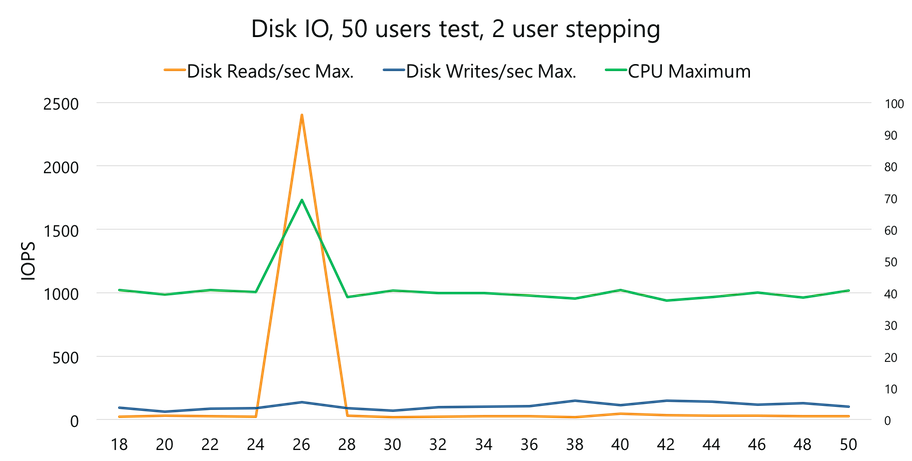
CPU Peaks Correlate With IO Peaks
While all of the previous FSCT tests have been performed on SSDs, we also looked at comparing performance when running FSCT workloads on HDDs and comparing that against SSDs.
When comparing the CPU load of the same workload running on HDD and SSDs, the average CPU is higher on HDDs.
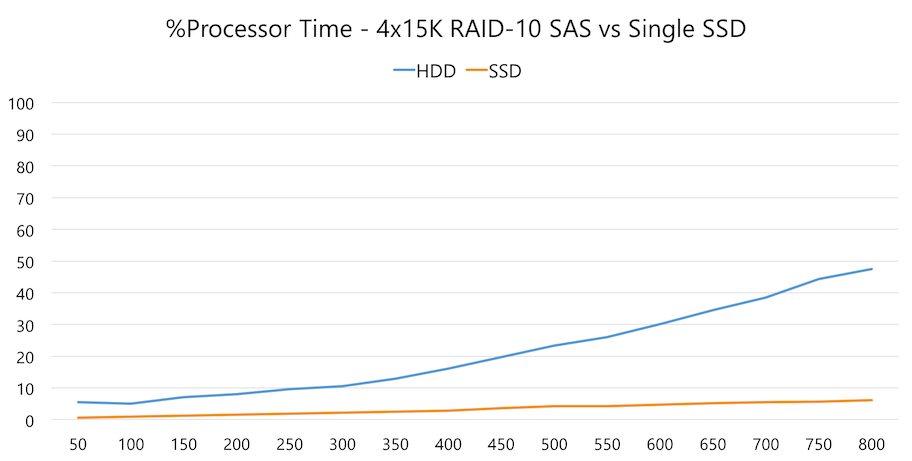
Higher CPU with HDDs
This higher CPU on HDDs is, in part, explained by the higher disk queue length seen with HDDs. The chart below shows the results of these tests with the disk queue length on HDDs significantly higher as the number of users in the tests increases.
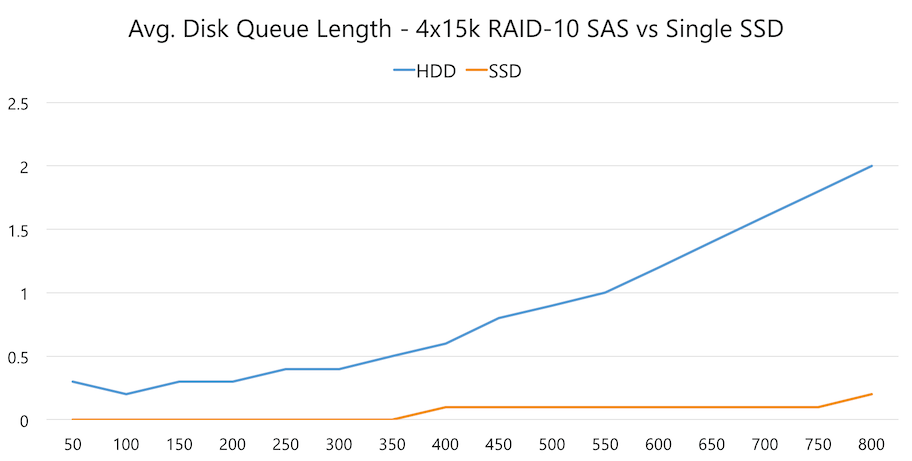
Higher Avg. Disk Queue Length with HDDs
It’s clear then that any high performing storage platform will not only improve storage performance, it will reduce the load on your compute, providing improved user experience across multiple layers of your infrastructure.
Part 3
In part 3, I’ll cover file access performance and summarise our recommendations for what you should be doing to get the best performance out of folder redirection.
