Replicating Our 2015 Folder Redirection Performance Tests In Your Own Lab
Helge, Shawn and myself had a great session this week at Citrix Synergy with our session SYN502: I’ve got 99 problems, and folder redirection is every one of them.
We covered quite a number of test scenarios, so in this article, I want to share the approaches that we used for our tests, so that you can replicate them in your own environments.
Test Environment
In my lab, I’ve used Windows Server 2012 R2 Hyper-V; however the hypervisor isn’t really that important, as long as you’re performing all of your tests on the same hypervisor.
The virtual machine configuration used for the file server VMs, were configured with 2 vCPUs and 4 GB of RAM. I typically use Dynamic Memory on Hyper-V; however for these tests a fixed RAM sizing was used to ensure that as RAM demand in the VM changed, that performance metrics are not adversely affected.
Client virtual machines were also configured with 2 vCPUs but with Dynamic Memory.
This year, we have concentrated on testing SMB 3.02 as the primary version of SMB. We have used Windows 8.1 on the client side and Windows Server 2012 R2 and Windows Server 2008 R2 on the server side - so because Windows 8.1 and Windows Server 2012 R2 are SMB 3.02 aware, they will negotiate that version. When Windows 8.1 opens a connection to Windows Server 2008 R2, an SMB 2.1 connection is made.
All virtual machines were deployed with the latest updates as at May 2015.
Throughput Tests with DiskSpd
To test the throughput capabilities of SMB 3.02 and SMB 2.1, I’ve used the DiskSpd 2.0.15 utility available from Microsoft.
DiskSpd is a storage load generator / performance test tool from the Windows/Windows Server and Cloud Server Infrastructure Engineering teams.
You can liken DiskSpd to Iometer; like Iometer, I can use DiskSpad to test various IO workload simulations by selecting block sizes and read/write however with DiskSpd I can specify a file path as the test target, including UNC paths.
Rather than cover complete details in this post on how DiskSpd works, I instead recommend reading this post by Jose Barreto: DiskSpd, PowerShell and storage performance: measuring IOPs, throughput and latency for both local disks and SMB file shares.
One very useful part from that article that I will replicate here is the parameters table for DiskSpd. With this table, I was able to create the specific tests that were useful for me to determine the throughput performance for both SMB 2.1 and SMB 3.02.
| Parameter | Description | Notes |
|---|---|---|
| -c | Size of file used. | Specify the number of bytes or use suffixes like K, M or G (KB, MB, or GB). You should use a large size (all of the disk) for HDDs, since small files will show unrealistically high performance (short stroking). |
| -d | The duration of the test, in seconds. | You can use 10 seconds for a quick test. For any serious work, use at least 60 seconds. |
| -w | Percentage of writes. | 0 means all reads, 100 means all writes, 30 means 30% writes and 70% reads. Be careful with using writes on SSDs for a long time, since they can wear out the drive. The default is 0. |
| -r | Random | Random is common for OLTP workloads. Sequential (when r is not specified) is common for Reporting, Data Warehousing. |
| -b | Size of the IO in KB | Specify the number of bytes or use suffixes like K, M or G (KB, MB, or GB). 8K is the typical IO for OLTP workloads. 512K is common for Reporting, Data Warehousing. |
| -t | Threads per file | For large IOs, just a couple is enough. Sometimes just one. For small IOs, you could need as many as the number of CPU cores. |
| -o | Outstanding IOs or queue depth (per thread) | In RAID, SAN or Storage Spaces setups, a single disk can be made up of multiple physical disks. You can start with twice the number of physical disks used by the volume where the file sits. Using a higher number will increase your latency, but can get you more IOPs and throughput. |
| -L | Capture latency information | Always important to know the average time to complete an IO, end-to-end. |
| -h | Disable hardware and software caching | No hardware or software buffering. Buffering plus a small file size will give you performance of the memory, not the disk. |
For the DiskSpd tests that I ran in my environment, I ran DiskSpd against a 256Mb file for 120 seconds with various block sizes with separate tests for read and write (i.e. I ran 100% read or 100% write). Here’s two sample commands for running 4K block sizes and using read or write tests:
diskspd.exe -c256M -d120 -si -w0 -t2 -o8 -b4K -h -L \\mb-win81\diskspd\testfile.dat
diskspd.exe -c256M -d120 -si -w100 -t2 -o8 -b4K -h -L \\mb-win81\diskspd\testfile.dat
Each of these tests uses 2 threads (1 per vCPU) and then from the output I’ve used the total MB/s seen from both threads as the result.
File Server Capacity Tool
To appropriate some type of folder redirection tests, I used the File Server Capacity Tool - this was about the best tool that I could find that could simulate home folder access (if you know of another, please let me know).
I won’t go into detail on how to use FSCT, instead I recommend reading this article by Mark Morowczynski - How to use the File Server Capacity Tool (FSCT) on Server 2012 R2.
The File Server Capacity Tool binaries are available from the following links:
In my lab environment, I’ve used two physical hosts with the file server targets on one host (to ensure no resource contention) and the controller and clients on a separate host. The two hosts are connected via a 1GB switch.
Other than specific tests where we wanted to know the effect of anti-virus on the file server, no AV application was installed on any server or client (physical or virtual).

File Server Capacity Tool architecture
FSCT comes with a single work load - Home Folders. Which is fortunately great for our use, should be as similar as possible to real work use of users interacting with their Documents or Desktop folders that are redirected to their home drive.
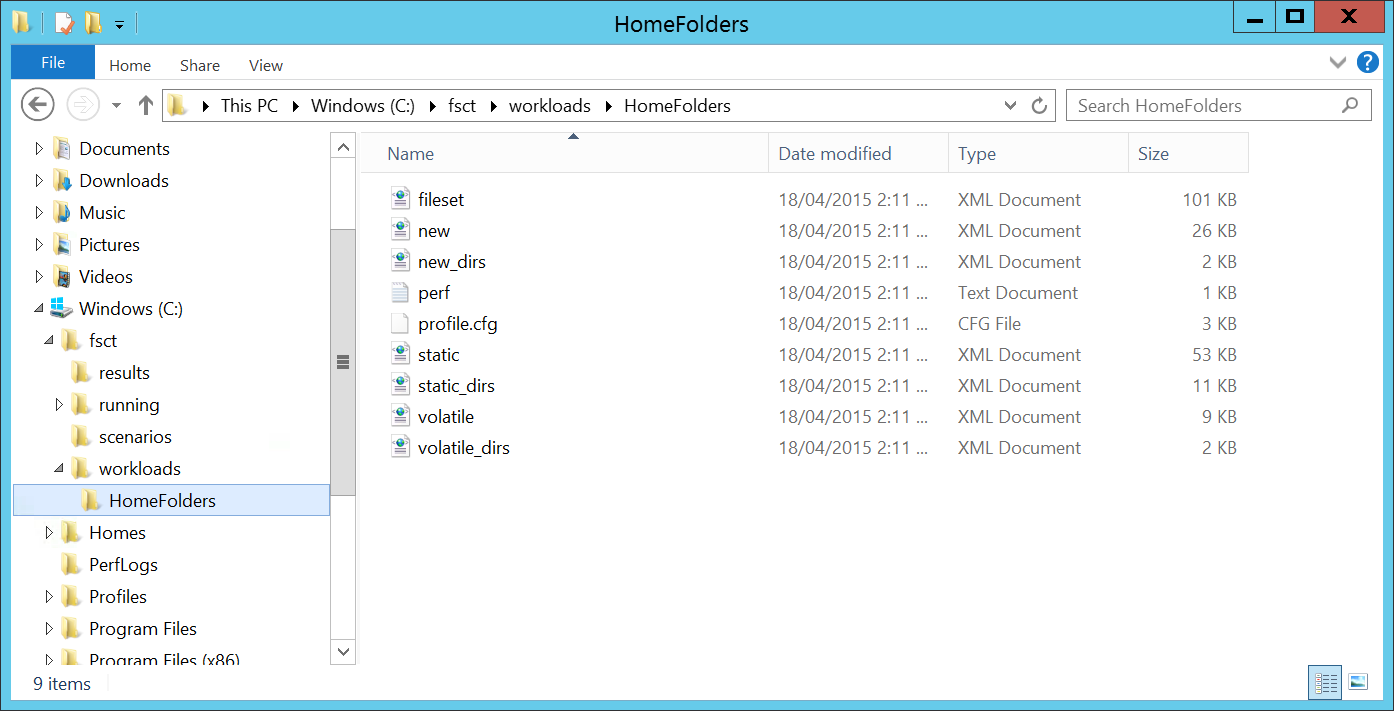
File Server Capacity Tool - Home Folders Workload
A single run of an FSCT workload simulation can take a very long time, so expect each simulation to run from 3 hours or more depending on the total number of user sessions that you want to get to. In each workload simulation, I ran from 50 to 800 user sessions, stepping by 50 user sessions for each test.
Here’s what a workload simulation looks like:
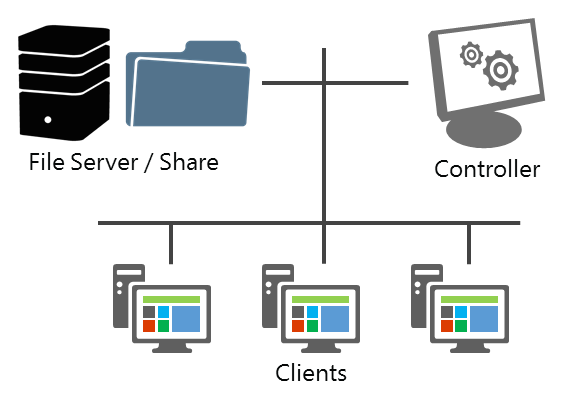
How File Server Capacity Tool workload simulations are run
To demonstrate an example, here’s an overview of the environment and the FSCT commands that I used to run the workloads for each test.
- File Server: FILE3 (192.168.0.79, Windows Server 2012 R2)
- Controller: CNTRLR (Windows 8.1)
- Clients: CLIENT1, CLIENT2, CLIENT3, CLIENT4 (Windows 8.1; each client ran up to 200 concurrent sessions)
The basic steps for running FSCT were as follows:
- Prepare the Domain Controller (create the user accounts used by FSCT)
- Prepare File Server (create the file data used by the workload. This required ~65GB for 800 users and ~92GB by the time the tests completed. Create a dedicated partition or disk for hosting the data)
- Prepare Controller
- Prepare Client
- Run Client
- Run Controller
So the commands I used for my environment (run on the various VMs used in the test) were:
Create 800 users accounts (200 user accounts per client, with 4 clients): fsct prepare dc /users 200 /clients CLIENT1,CLIENT2,CLIENT3,CLIENT4 /password Passw0rd
Prepare the file server - create user data on the E: partition, using the HomeFolders workload: fsct prepare server /clients CLIENT1,CLIENT2,CLIENT3,CLIENT4 /password Passw0rd /users 200 /domain home.stealthpuppy.com /volumes E: /workload HomeFolders
Prepare the Controller: fsct prepare controller
Prepare the Client (run per client VM): fsct prepare client /server fsctserver /password Passw0rd /users 200 /domain home.stealthpuppy.com /server_ip 192.168.0.79
Run the workload on each client (run per client VM): fsct run client /controller CNTRLR /server fsctserver /password Passw0rd /domain home.stealthpuppy.com
Start the tests (run on the Controller VM): fsct run controller /server FILE3 /password Passw0rd /volumes E: /clients CLIENT1,CLIENT2,CLIENT3,CLIENT4 /min_users 50 /max_users 800 /step 50 /duration 720 /workload HomeFolders
Each command is run on the respective virtual machine - the FSCT binaries were run from C:\FSCT.
uberAgent for Splunk
To make it simple to measure logon times, there’s only one tool worth using to view metrics and that’s of course uberAgent for Splunk. uberAgent makes it simple to report on logon times - so all you’ll need to do is setup roaming profiles, log onto a machine with the agent installed and view the Logon Duration report.
I recommend creating a large enough profile, or one that is indicative of profiles that you may have in production. For real stress testing, the number of files in the profile is more important than the total profile size.
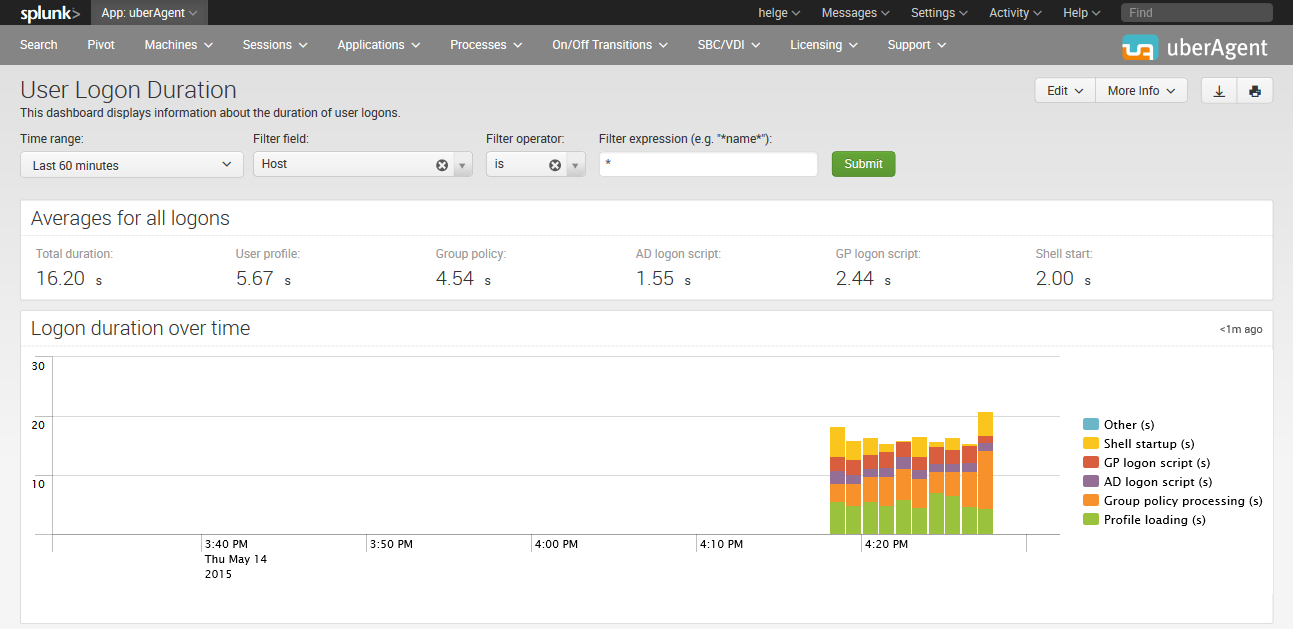
Viewing logon times in uberAgent
If you want to use uberAgent in your lab, I recommend contacting https://uberagent.com/download/ for info on whether you qualify for a consultants license.
